MyChoice Reveals the Top 10 Safest and Most Dangerous Cities for Driving in Ontario
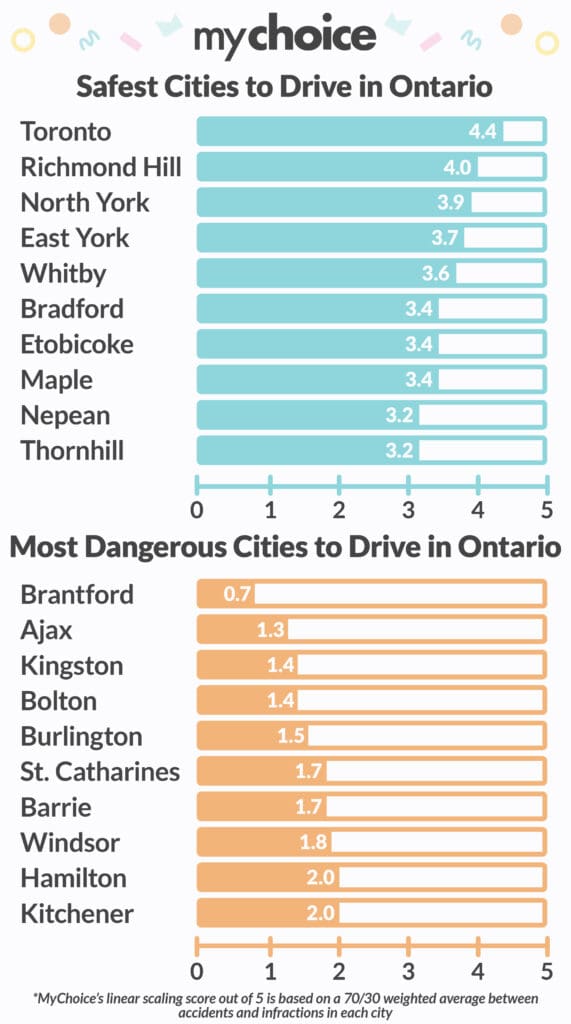
In mid-2023, the Ontario Provincial Police reported a 32% increase in fatal collisions, compared to the same time in 2022. This statistic underscores the importance of understanding which areas in Ontario are safer for drivers. Here at MyChoice, we conducted an internal study, drawing from data collected from over 100,000 quotes since 2020, including 2,274 accidents and 5,080 tickets, revealing the safest and most dangerous cities for drivers across the province. The study employed a detailed methodology based on the weighted averages of accidents and infractions with a 70/30 importance ratio, creating a comprehensive scoring system from 0 to 5.

*Source: MyChoice Database
Cities like Brantford emerge as particularly challenging for drivers, scoring as low as 0.7 out of 5. This city not only leads in the percentage of traffic tickets issued but also in the number of accidents. On the other end of the spectrum, Toronto stands out as relatively safer for drivers, with a high score of 4.4 out of 5. This ranking is attributed to its lower rates of traffic violations and accidents.
In light of these findings, drivers need to be aware of how traffic accidents can impact their Ontario car insurance rates. Aren Mirzaian, CEO of MyChoice, sheds light on this issue, emphasizing the complexities of insurance rate adjustments post-accident. “In Ontario, a key factor to consider is the nature of the accident – whether it’s at fault or not at fault. While not at fault accidents typically don’t lead to direct rate increases, they can still affect a driver’s ‘claims-free’ discount, potentially increasing premiums by 5-15% depending on the insurance carrier.” – Mirzaian notes.
Furthermore, Ontario’s insurance system operates under ‘no-fault’ insurance, meaning that your insurer covers your damages regardless of who caused the accident. However, this doesn’t mean fault isn’t considered. Insurance companies use fault determination rules to decide the relative percentage of fault in an accident, which can influence claim amounts and potentially impact future premiums.
Raw Data for study:
% Of Drivers With Infractions on Record
- BRANTFORD: 18.18%
- HAMILTON: 13.38%
- BARRIE: 13.09%
- AJAX: 13.05%
- BOLTON: 12.70%
- KINGSTON: 12.58%
- ST CATHARINES: 11.79%
- WINDSOR: 10.39%
- KITCHENER: 10.16%
- BRAMPTON: 10.07%
- ETOBICOKE: 8.10%
- GUELPH: 8.53%
- BRADFORD: 7.94%
- WHITBY: 7.72%
- NEPEAN: 7.01%
- THORNHILL: 6.99%
- MAPLE: 6.70%
- RICHMOND HILL: 6.23%
- NORTH YORK: 6.23%
- TORONTO: 6.17%
% Of Drivers With Accidents on Record
- BRANTFORD: 15.15%
- AJAX: 14.69%
- KINGSTON: 13.84%
- BURLINGTON: 13.49%
- WINDSOR: 12.64%
- BARRIE: 12.27%
- BRAMPTON: 12.12%
- HAMILTON: 11.92%
- OAKVILLE: 11.73%
- LONDON: 11.61%
- MISSISSAUGA: 10.44%
- SCARBOROUGH: 10.27%
- THORNHILL: 10.22%
- NEPEAN: 10.15%
- GUELPH: 10.14%
- BRADFORD: 9.32%
- ETOBICOKE: 9.26%
- WHITBY: 8.13%
- NORTH YORK: 7.65%
- EAST YORK: 7.54%
- TORONTO: 6.13%


