


MyChoice Study Reveals that Life Insurance Policy Holders in Ontario, Alberta, BC, Quebec and Newfoundland Lack Sufficient Coverage
Canada now has the highest household debt-to-income ratio among G7 countries, reaching over 180%. This debt burden is particularly alarming in the context of rising costs of living and high interest rates, with nearly half of all mortgages in Canada due for renewal in 2024 and 2025. In light of these financial realities, more and more Canadians turn to life insurance as a tool of financial protection. According to the most recent report by the Canadian Life and Health Insurance Association (CLHIA), 22 million Canadians currently own life insurance policies amounting to $5.5 trillion in coverage. While the average household life insurance protection in Canada is $474,000, the question remains: is that enough to cover one’s debts and financial obligations, and how much life insurance do you need in Canada?
To address this critical issue, our team at MyChoice, a leading insurance comparison platform in Canada, conducted a study to analyze the adequacy of life insurance coverage across Canadian provinces. To provide a comprehensive estimate of the life insurance coverage required for Canadian households, we analyzed both household income and financial asset data across all the provinces. We then compared our “recommended coverage” amount with the average coverage per insured household in each province as outlined by the CLHIA.
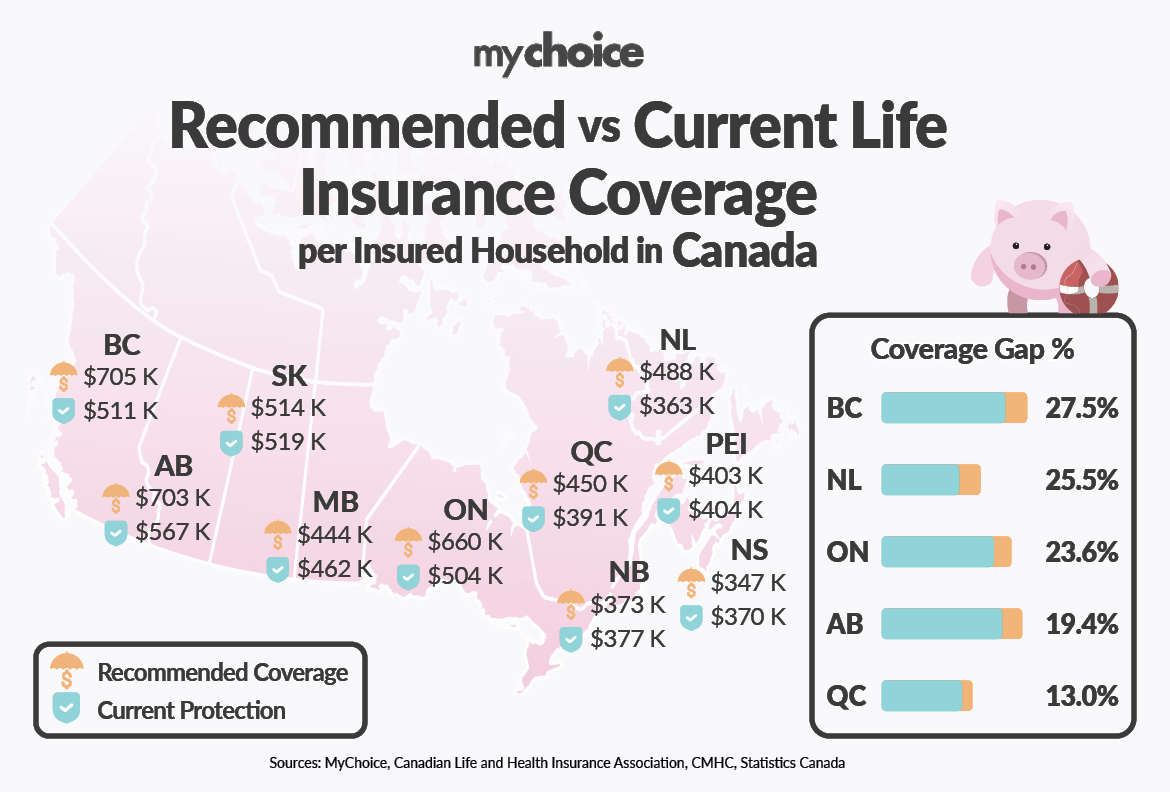
Our findings reveal a troubling trend – people in BC, Ontario, Alberta, Quebec and Newfoundland don’t have enough life insurance to cover their expenses. In British Columbia, households are under-insured by 27.5%, and in Ontario, by 23.6%. Even in Alberta, which has a higher average income, families are under-covered by 19.4%. On the other hand, provinces like Manitoba and Nova Scotia fare better, with minimal coverage gaps or even slight over-insurance. However, the national picture remains concerning: the average Canadian household may not be adequately prepared to handle their financial obligations in the event of an unexpected death.
For example, in British Columbia, where the cost of living is particularly high, the average needed coverage is $704,700, yet households are insured for only $511,000, leaving a gap of $193,700. Similarly, in Ontario, the required life insurance amount is $659,600, but the average coverage is $504,000, resulting in a shortfall of $155,600.
Aren Mirzaian, CEO of MyChoice, emphasizes the importance of reviewing life insurance policies: “Many Canadian families are unaware that their current life insurance policies may not provide enough protection, especially with the rising costs of living and increasing mortgage debt,” says Mirzaian. “It’s crucial to regularly reassess your coverage to ensure that your family is fully protected financially. Life insurance is not just about covering your mortgage – it’s about securing your family’s future and providing peace of mind during difficult times.”
Raw Data:
| Province | Average Household Income Before Taxes ($) | Average Mortgage Debt Value ($) | Average Non-Mortgage Debt ($) | Average Pension Assets Value ($) | Average Non-Pension Assets Value ($) | Approximate Coverage Needed ($) |
|---|---|---|---|---|---|---|
| British Columbia | 108,600 | 340,600 | 46,600 | 336,500 | 106,200 | 704,700 |
| Alberta | 119,700 | 274,800 | 49,500 | 313,300 | 145,500 | 703,400 |
| Ontario | 116,000 | 288,300 | 39,600 | 367,900 | 112,400 | 659,600 |
| Saskatchewan | 99,800 | 204,800 | 40,800 | 335,500 | 94,600 | 514,100 |
| Newfoundland and Labrador | 91,100 | 194,600 | 32,000 | 340,200 | 36,600 | 487,500 |
| Quebec | 92,000 | 182,800 | 23,600 | 325,600 | 75,200 | 449,600 |
| Manitoba | 97,300 | 183,700 | 32,600 | 366,300 | 87,400 | 443,700 |
| Prince Edward Island | 87,900 | 136,200 | 28,300 | 341,500 | 35,600 | 402,700 |
| New Brunswick | 85,400 | 107,700 | 30,000 | 321,000 | 41,900 | 372,600 |
| Nova Scotia | 87,900 | 146,400 | 33,600 | 391,000 | 57,700 | 346,600 |
Here’s how we approached the calculation for the recommended life insurance coverage:
Approximate Coverage Needed = (household income * 7 years) + average mortgage debt + average non-mortgage debt – pension assets – non-pension assets
*We multiplied household income by 7, a standard recommendation to account for the financial burden of losing seven years of income, ensuring the family has enough time to adjust to the loss.
Average mortgage and non-mortgage debt: This includes all major liabilities like mortgages, credit cards, loans, and lines of credit that a household may carry. Including these debts helps to ensure the life insurance coverage can settle these obligations.
Household savings: Pension assets include registered savings like RRSPs, RRIFs, and EPPs, while non-pension assets include financial vehicles such as TFSAs, stocks, bonds, and mutual funds.
| Province | Approximate Coverage Needed ($) | Average protection per insured household ($) | Coverage Gap % |
|---|---|---|---|
| British Columbia | 704,700 | 511,000 | 27.5% |
| Alberta | 703,400 | 567,000 | 19.4% |
| Ontario | 659,600 | 504,000 | 23.6% |
| Saskatchewan | 514,100 | 519,000 | -1.0% |
| Newfoundland and Labrador | 487,500 | 363,000 | 25.5% |
| Quebec | 449,600 | 391,000 | 13.0% |
| Manitoba | 443,700 | 462,000 | -4.1% |
| Prince Edward Island | 402,700 | 404,000 | -0.3% |
| New Brunswick | 372,600 | 377,000 | -1.2% |
| Nova Scotia | 346,600 | 370,000 | -6.8% |